Widgets
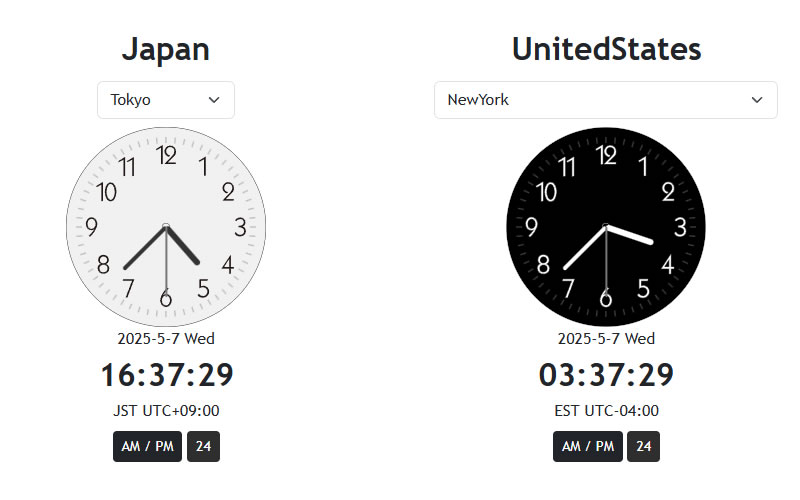
World Clock Widget
A multifunctional analog and digital world clock widget that lets you view the current time in major cities at a glance.
It displays the real-time local time, date, and time zone (UTC), with a simple toggle between 12-hour and 24-hour formats. Ideal for travelers, remote teams, and international schedule management.
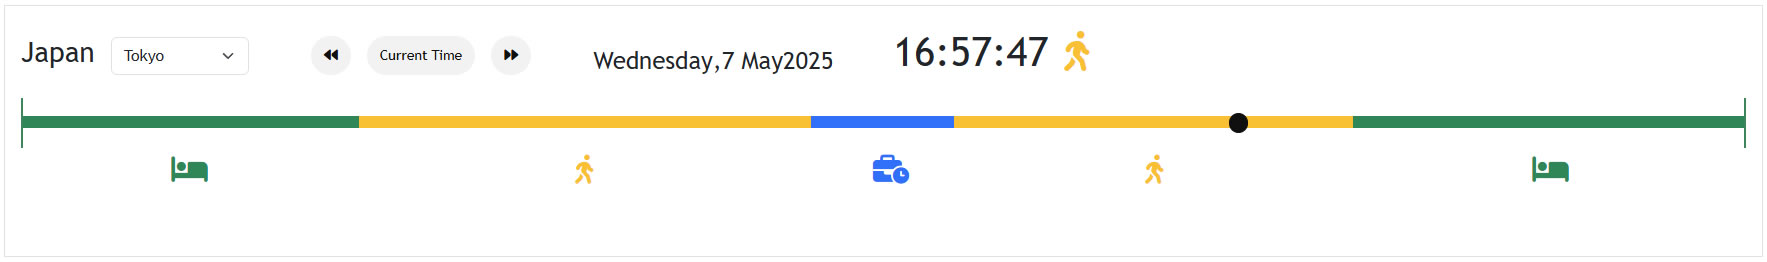
Timeline Widget
An interactive daily timeline widget that visually displays typical daily activities—such as sleeping, commuting, working, and relaxing—throughout a 24-hour cycle.
Time blocks are color-coded for clarity, and a real-time indicator shows the current position in the day.
This tool is perfect for tracking lifestyle rhythms, coordinating across time zones, or simply staying aware of daily schedules.
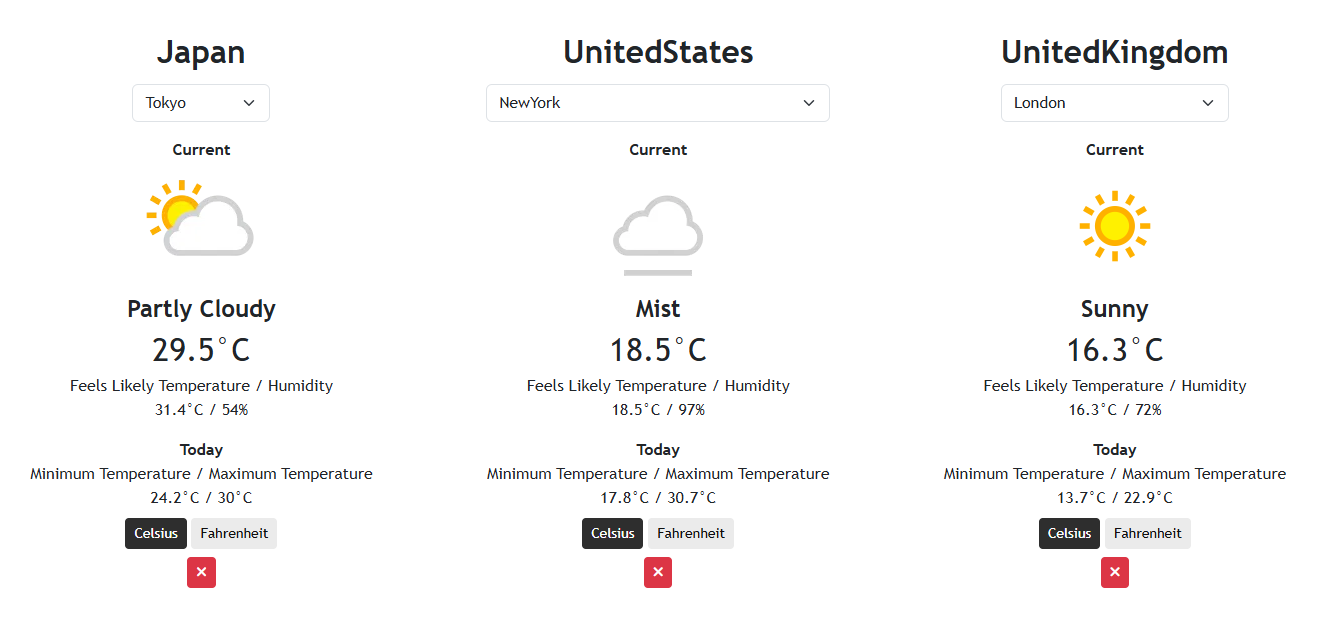
World Weather Widget
This multifunctional world weather widget allows you to check the current weather of major cities at a glance.
It displays local temperature, feels-like temperature, humidity, and weather conditions, and you can also check the minimum and maximum temperatures.
It is useful for travel and relocation schedules and planning, and is ideal for comparing the climate of different regions.
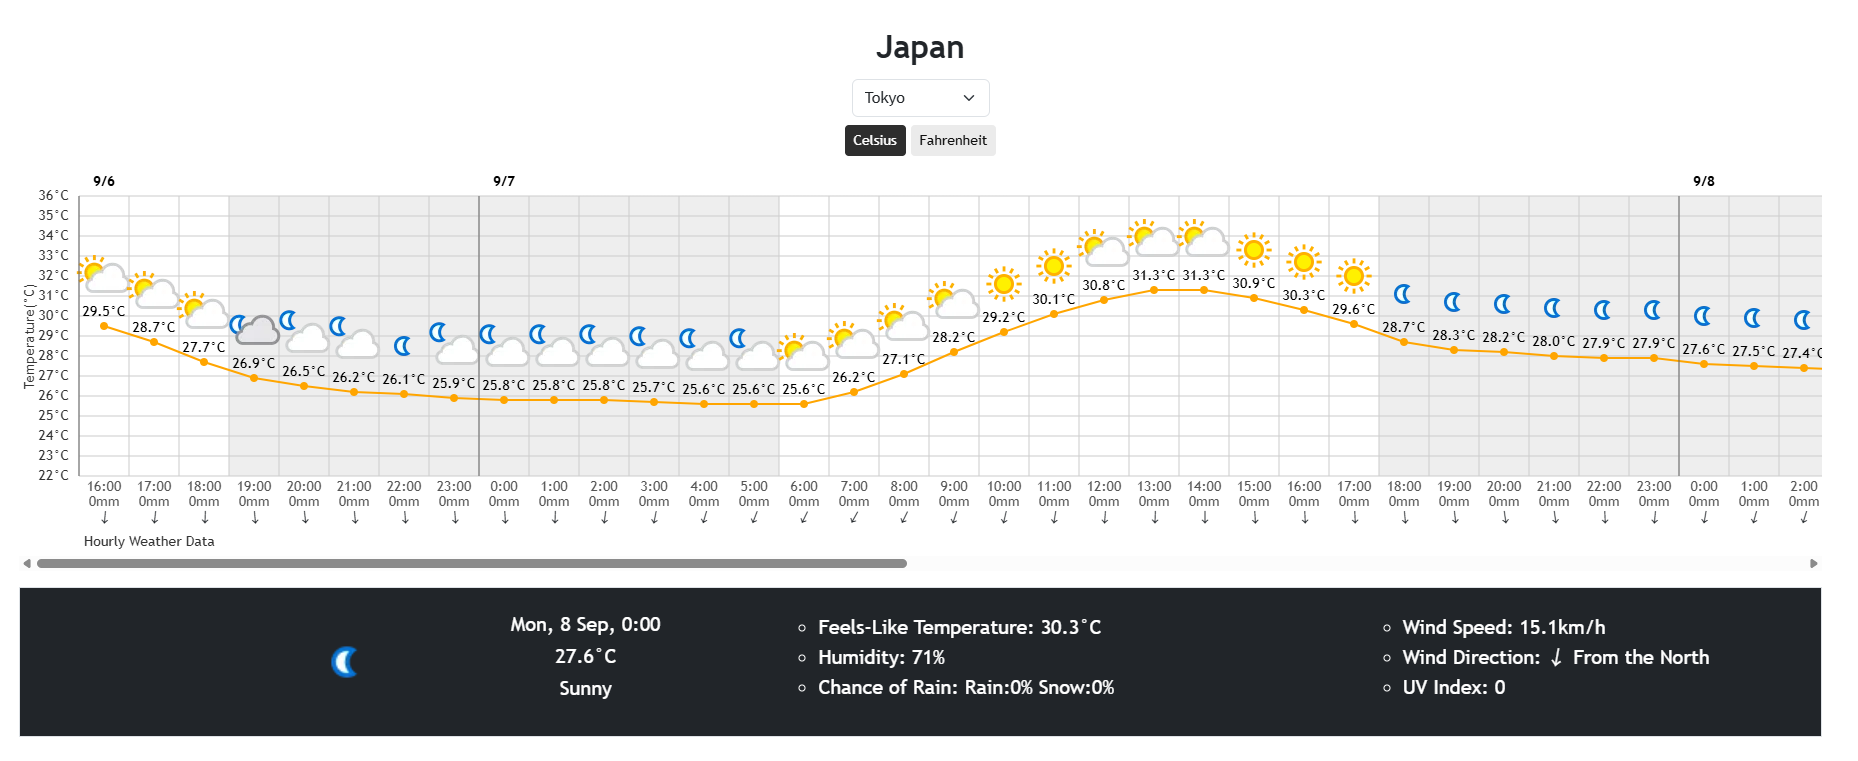
Hourly Weather Widget
This multifunctional hourly weather widget allows you to check the hourly weather forecast for major cities at a glance.
It displays temperature trends, feels-like temperature, precipitation, humidity, wind speed, and wind direction in graphs, allowing you to intuitively grasp changes on an hourly basis. It can display weather for up to 72 hours.
It is useful for travel schedules, event planning, and is ideal for comparing the climate of different regions.
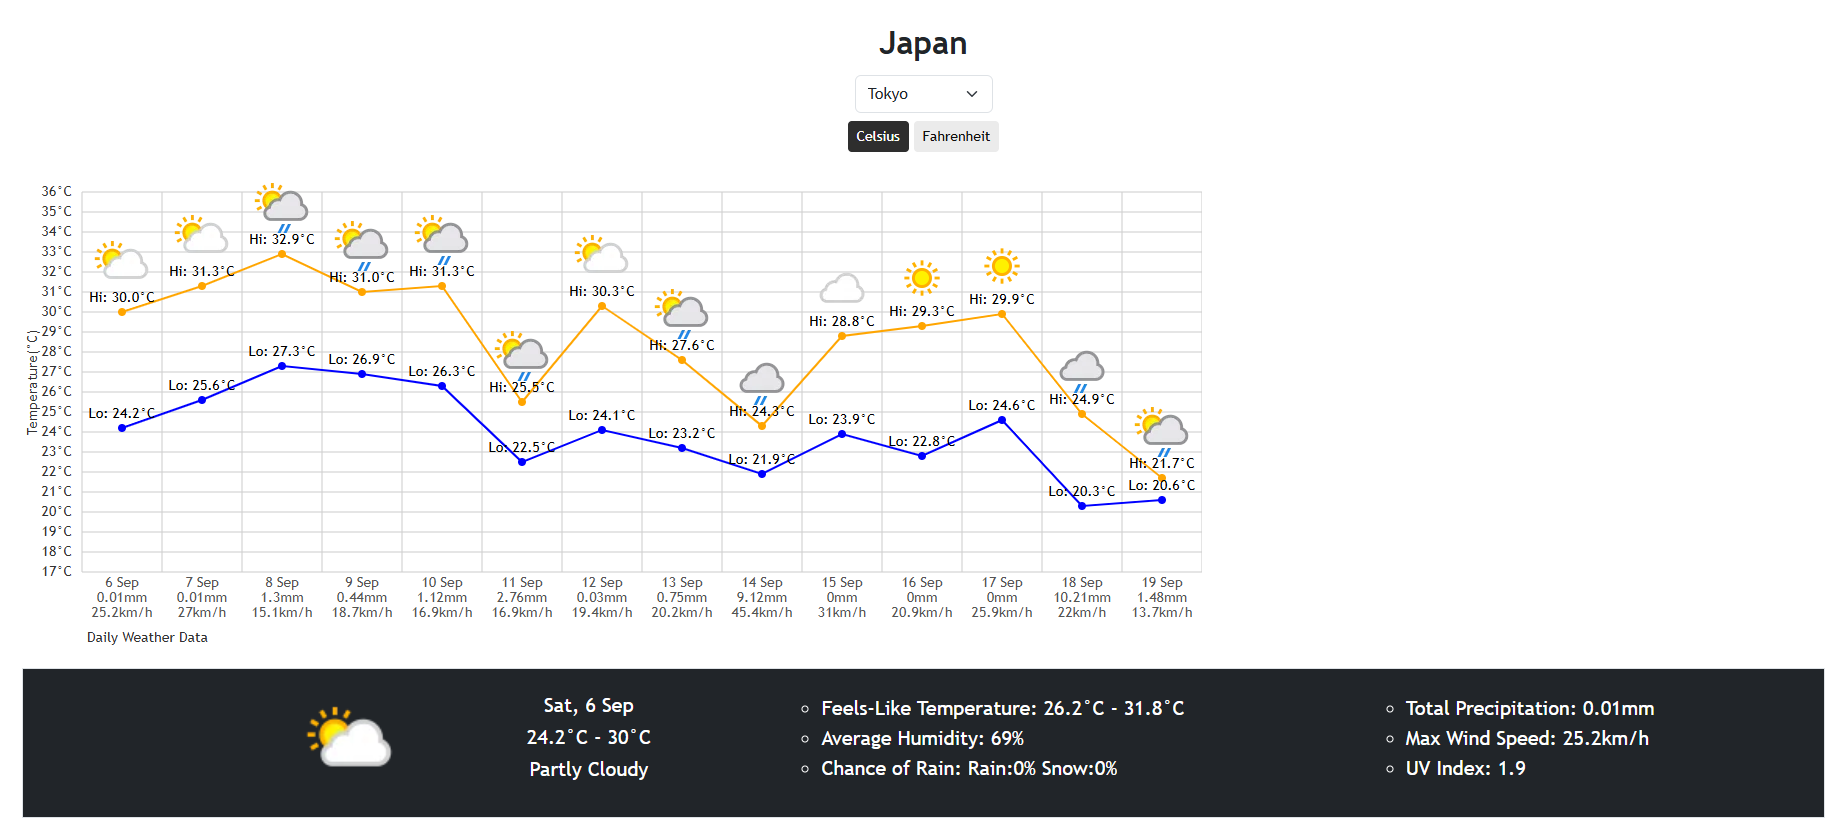
Weekly Weather Forecast Widget
This multifunctional weekly weather widget allows you to check daily weather forecasts for major cities at a glance.
It displays trends of maximum and minimum temperatures, precipitation, humidity, wind speed, and UV index clearly in graphs, allowing you to intuitively grasp weather trends over several days. It can display weather up to 14 days in advance.
It is ideal for travel and event planning, preparation for outdoor activities, and checking seasonal climate changes.
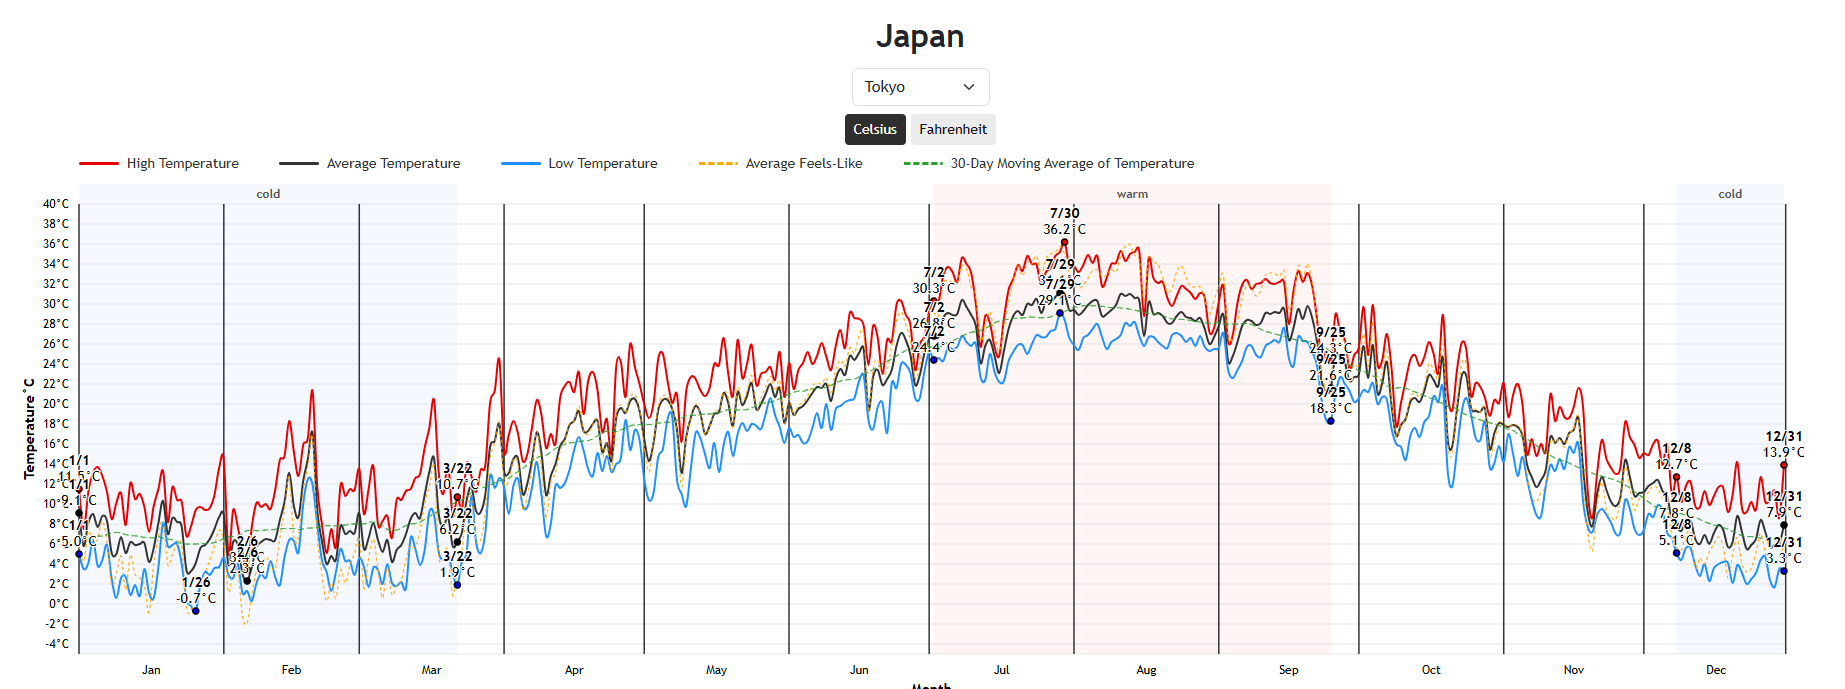
Monthly Average Temperature Widget
This multifunctional monthly average temperature widget allows you to check monthly average temperatures for major cities at a glance.
It displays trends of maximum temperature, minimum temperature, average temperature, and feels-like temperature in graphs, allowing you to intuitively grasp seasonal climate changes.
It is ideal for travel planning, preparing for long stays, comparing climates of various cities, and checking annual temperature trends.
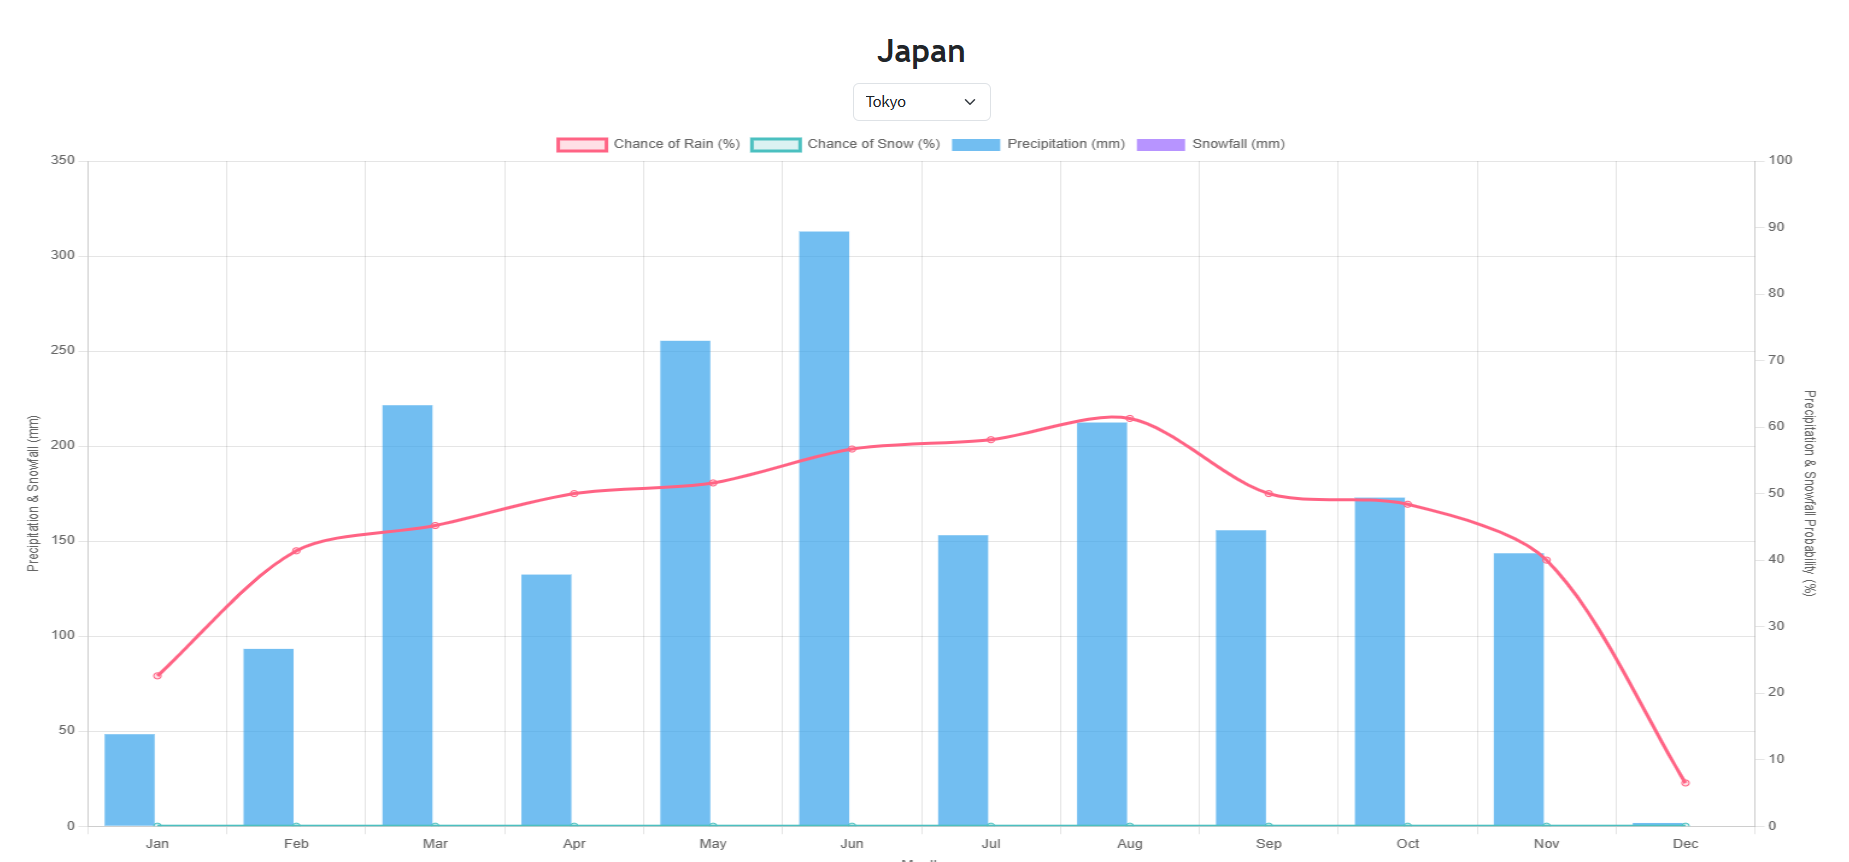
Monthly Precipitation Widget
This multifunctional monthly precipitation widget allows you to check monthly precipitation for major cities at a glance.
It displays precipitation, number of rainy days, and precipitation probability in bar and line graphs, allowing you to intuitively grasp seasonal rainfall trends.
It is ideal for planning travel or business trips, preparing for agriculture or outdoor activities, and comparing climates of different regions.
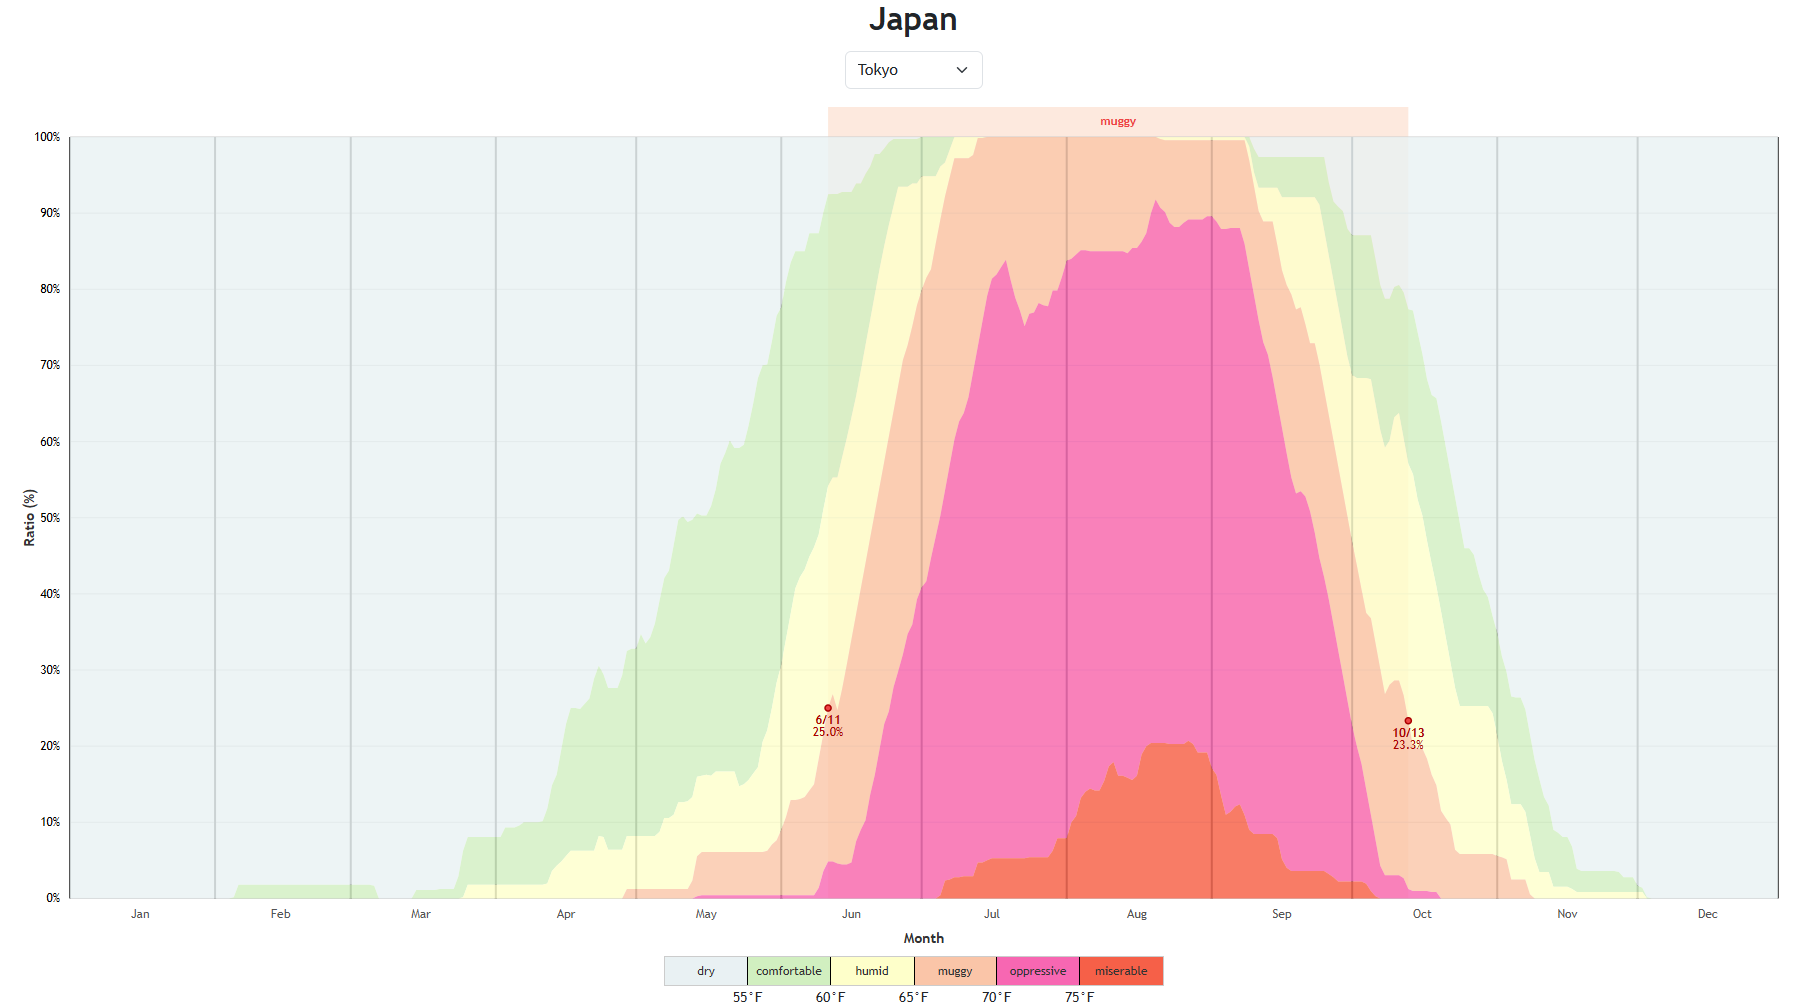
Humidity Comfort Level Widget
This multifunctional humidity comfort level widget allows you to check humidity levels and comfort at a glance for major cities.
It color-codes states such as dry, comfortable, and humid based on comfortable humidity ranges, allowing you to intuitively grasp changes in humidity throughout the year.
It is ideal for adjusting living environments, checking seasonal comfort factors, and international climate comparisons.
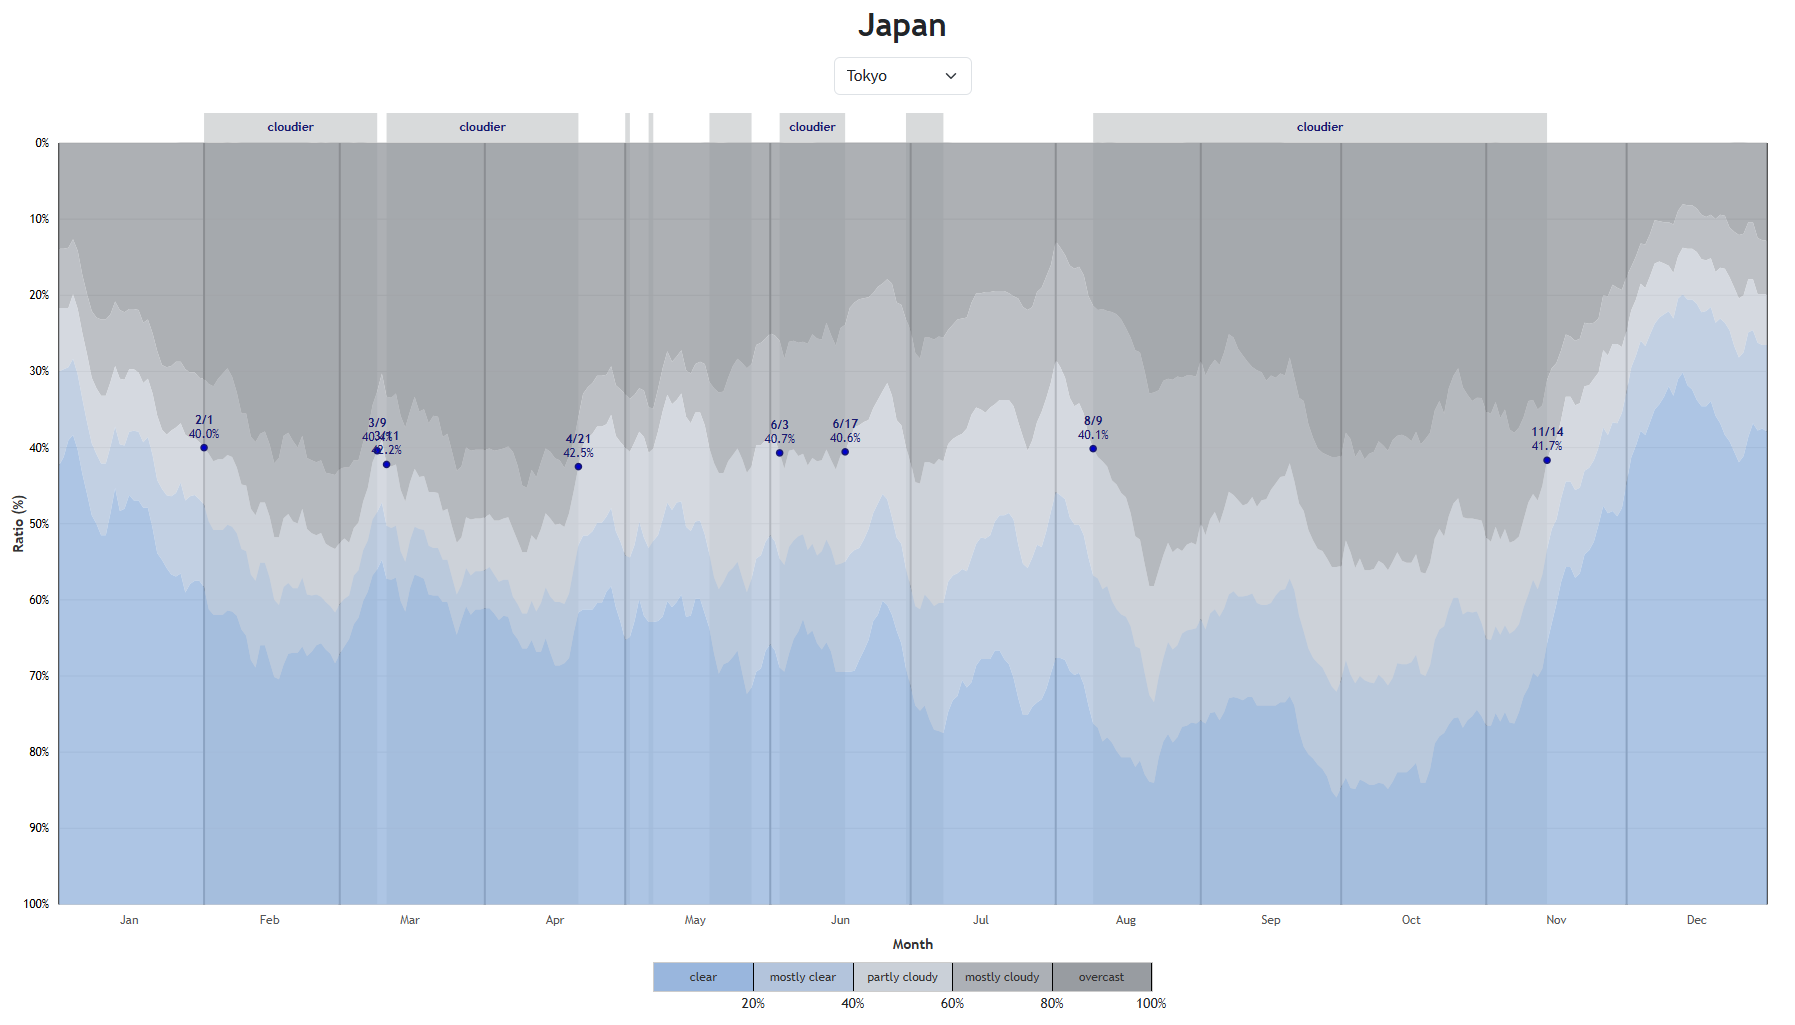
Annual Cloud Cover Trend Widget
This multifunctional annual cloud cover trend widget allows you to check annual cloud cover trends for major cities at a glance.
It visually indicates clear, mostly clear, cloudy, and overcast categories, allowing you to intuitively grasp changes in sky conditions throughout the year.
It is ideal for planning travel or outdoor events, comparing climates of different regions, and checking sunlight conditions.
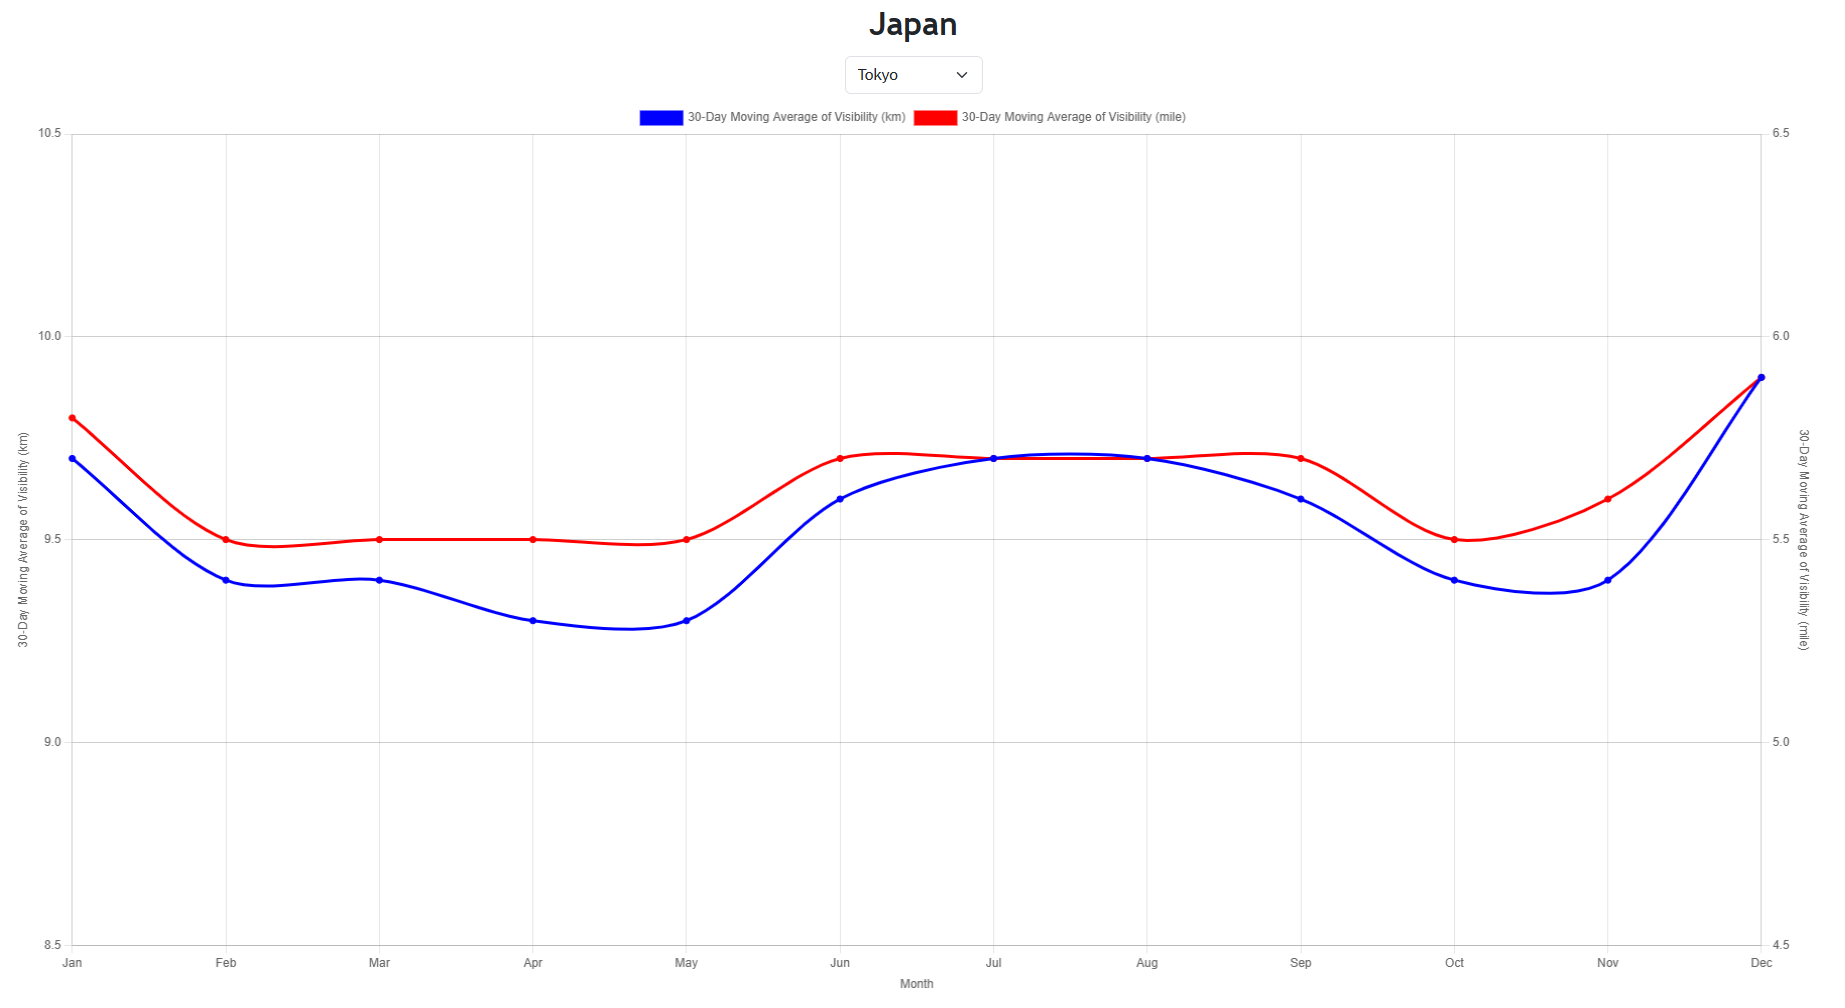
Visibility (Transparency) Widget
This multifunctional visibility (transparency) widget allows you to check visibility (transparency) trends for major cities at a glance.
It displays visibility indicating atmospheric transparency in both kilometers and miles and intuitively shows changes due to seasons and weather through a 30-day moving average.
It is ideal for ensuring safety in aviation and traffic, planning tours or outdoor activities, and comparing atmospheric conditions across regions.
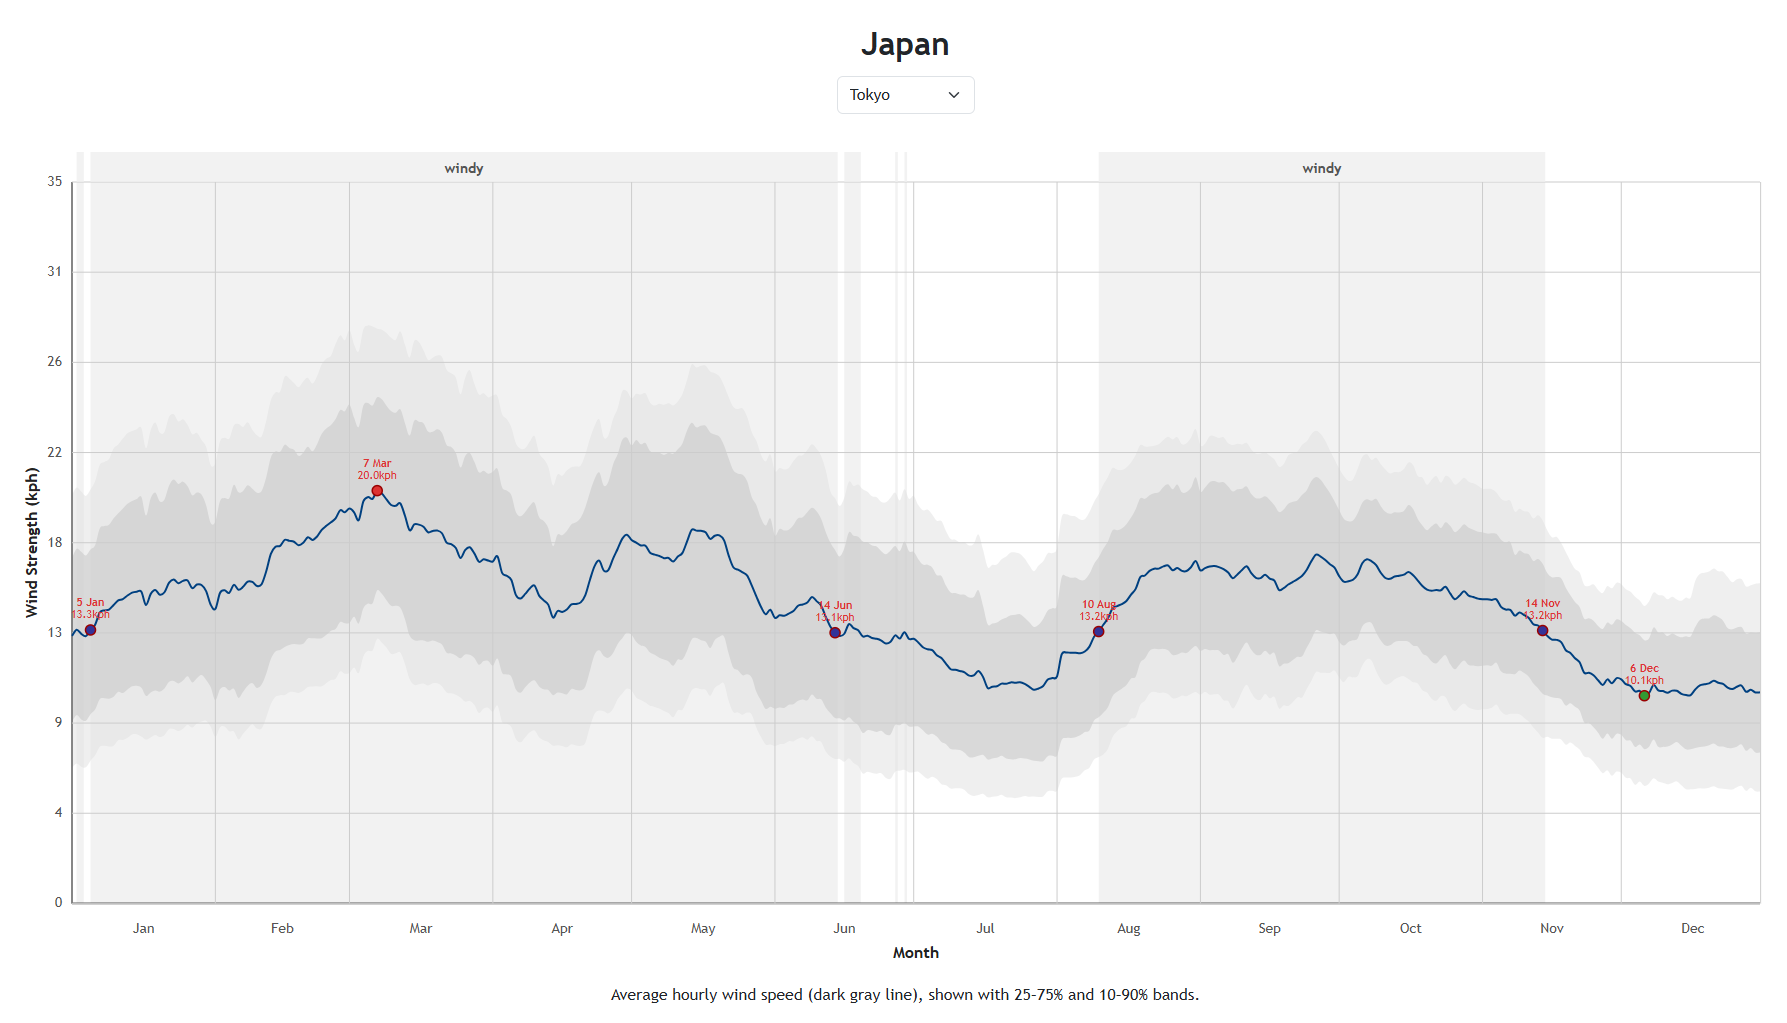
Wind Speed Widget
This multifunctional wind speed widget allows you to check wind speed trends for major cities at a glance.
It graphically displays average wind speed and maximum wind speed, allowing you to intuitively grasp wind strength throughout the year and seasonal changes.
It is ideal for ensuring safety in aviation and maritime activities, planning outdoor events, and comparing wind trends across regions.
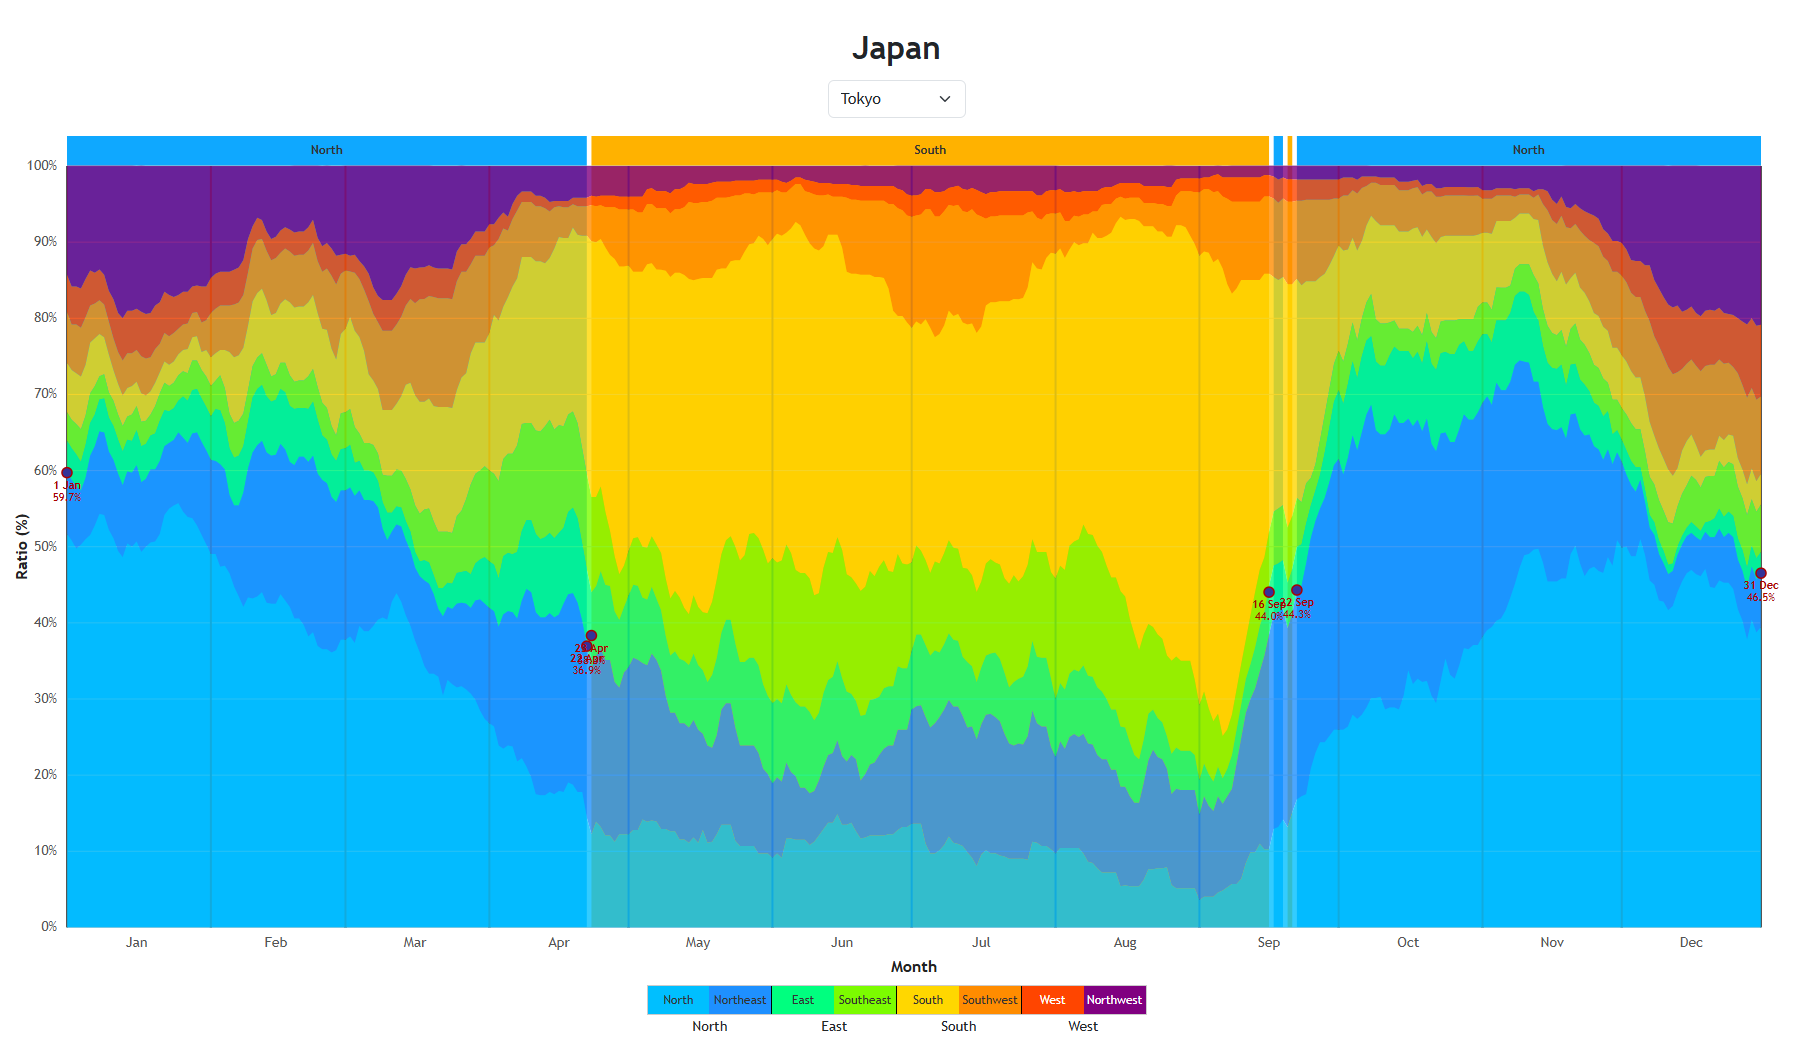
Wind Direction Widget
This multifunctional wind direction widget allows you to check annual wind direction trends for major cities at a glance.
It color-codes multiple wind directions including north, east, south, west, and their intermediates by percentage, allowing you to intuitively grasp seasonal wind direction trends.
It is useful for aviation, maritime navigation, meteorological observations, and understanding local climate characteristics.
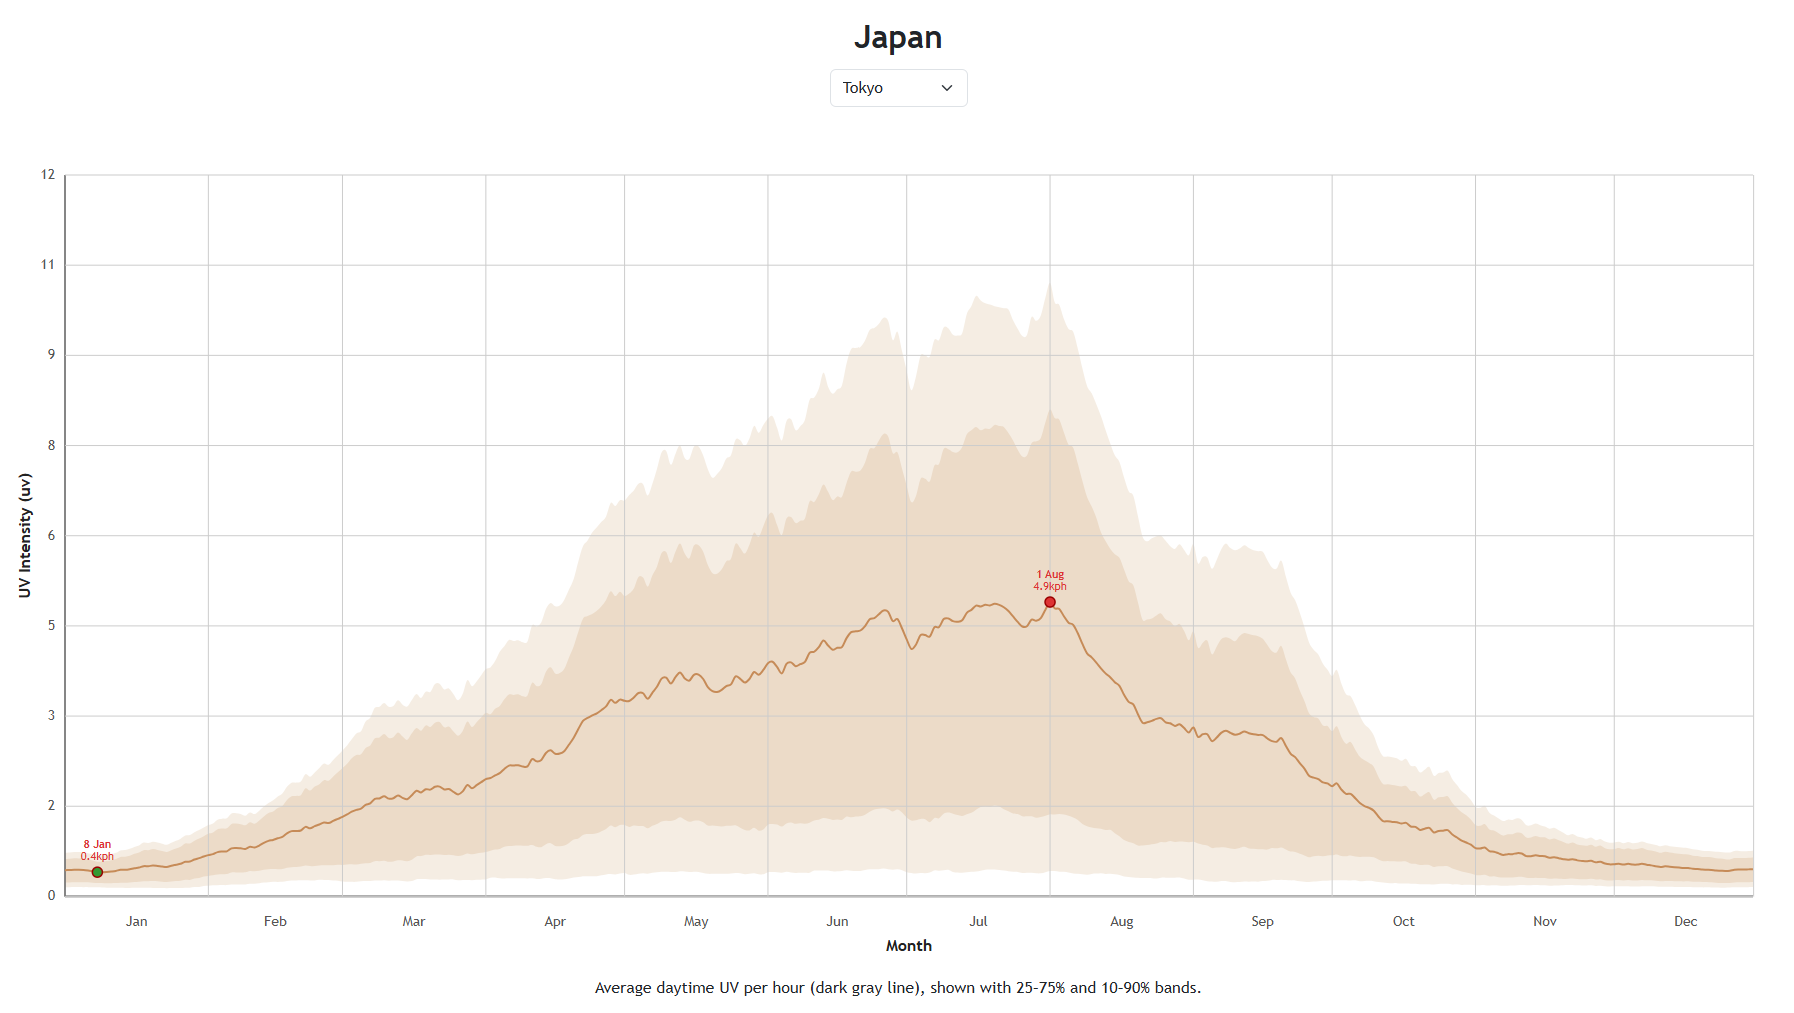
UV Index Widget
This multifunctional UV index widget allows you to check UV index trends for major cities at a glance.
It displays graphs of UV intensity throughout the year, allowing you to intuitively grasp trends and daily changes in UV exposure.
It is ideal for managing sunburn risk, skin health, safety in outdoor activities, and comparing UV environments across regions.
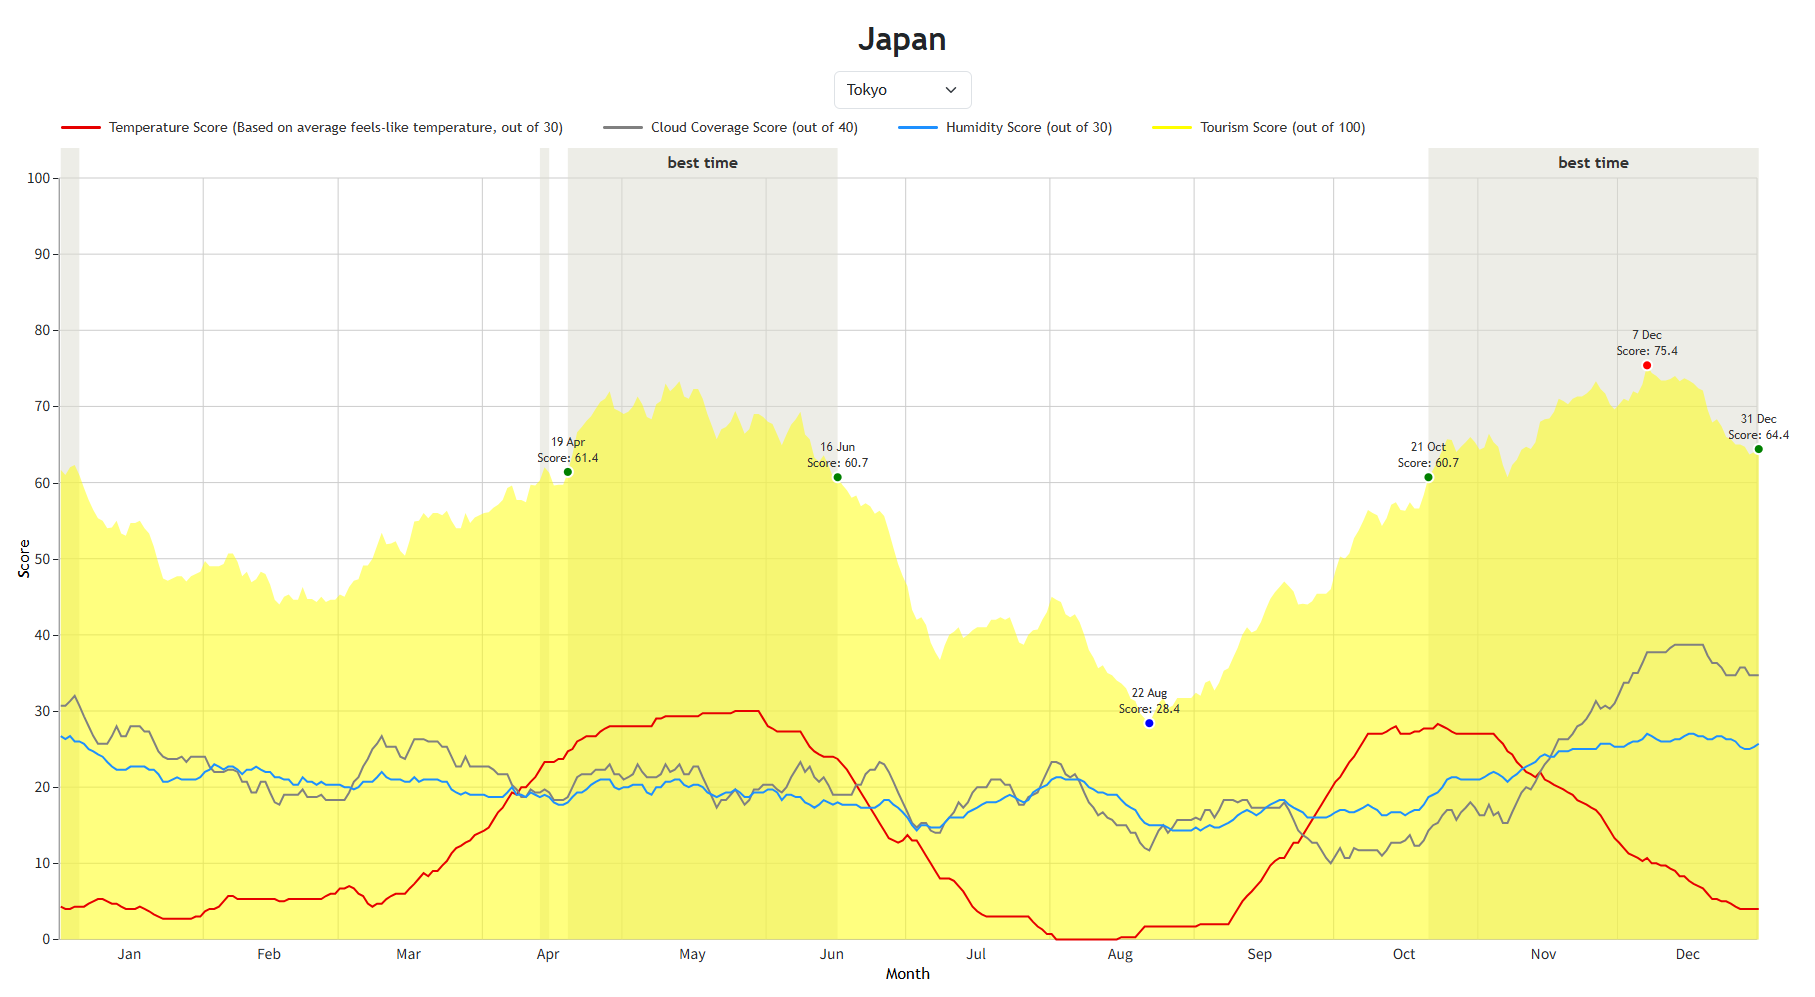
Tourism Score Widget
This multifunctional tourism score widget allows you to check the best times for tourism in major cities at a glance.
It displays a score based on temperature, humidity, and weather in graphs, allowing you to intuitively grasp the best times to visit and trends in comfort throughout the year.
It is ideal for planning travel, comparing accommodations, and confirming the best seasons.
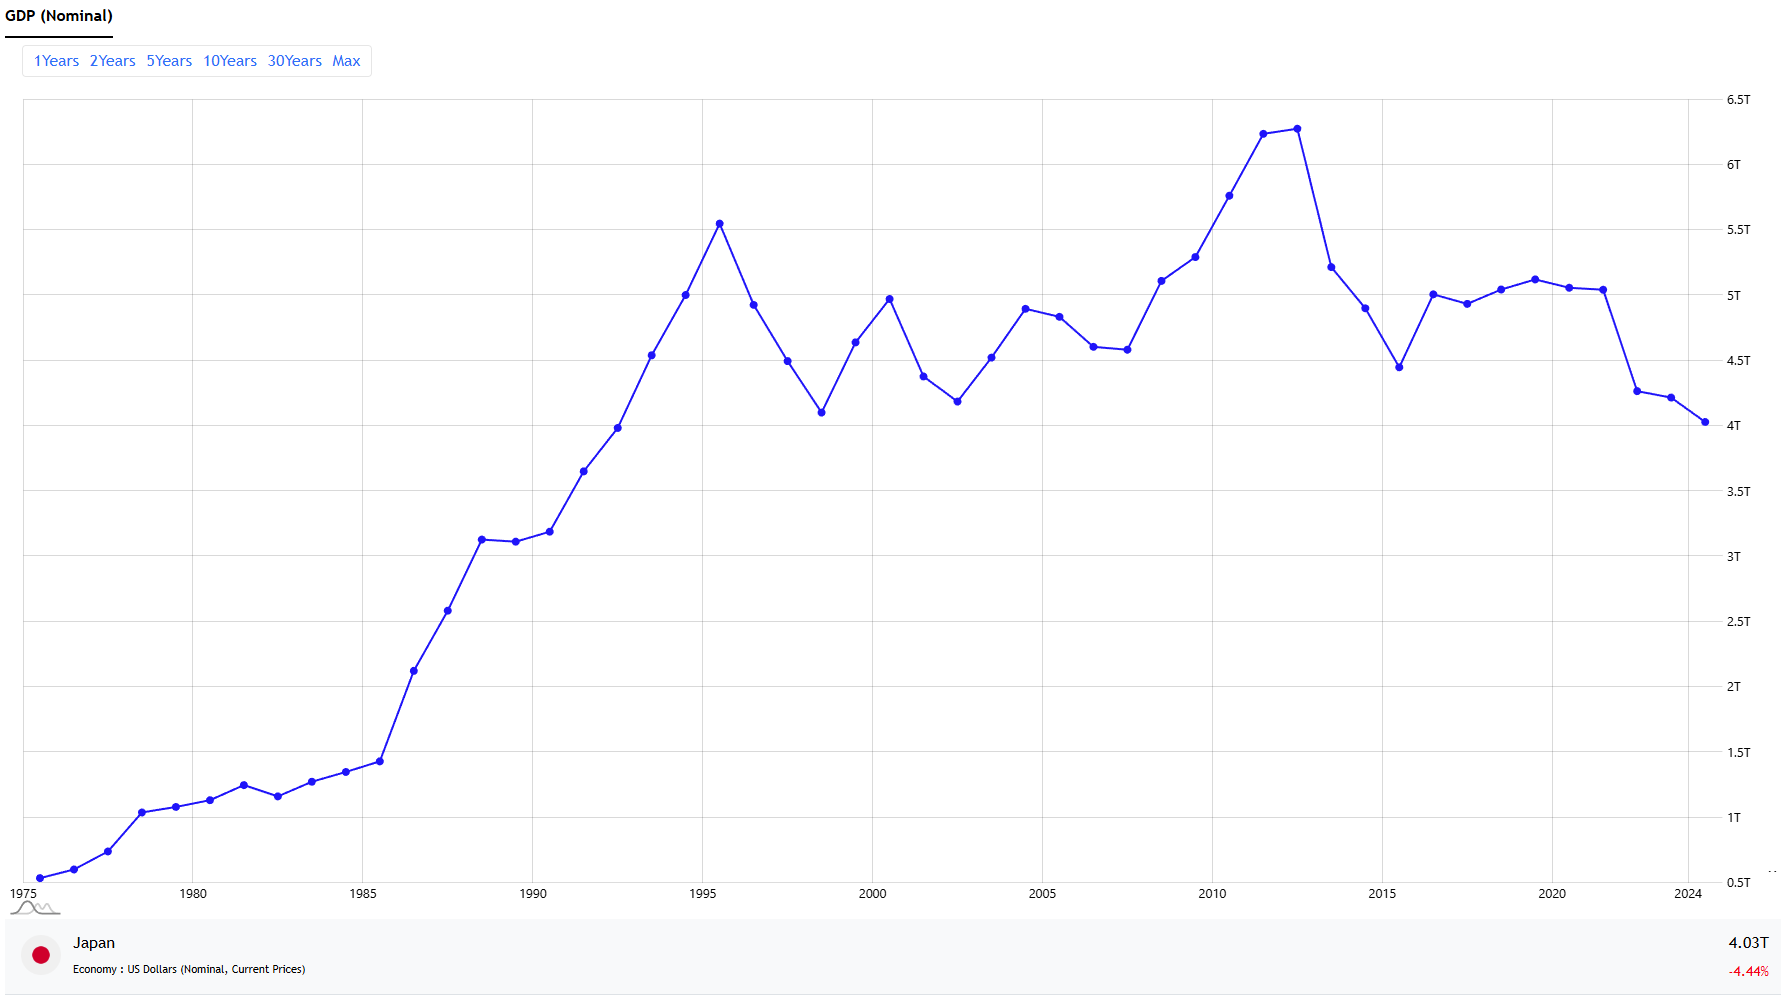
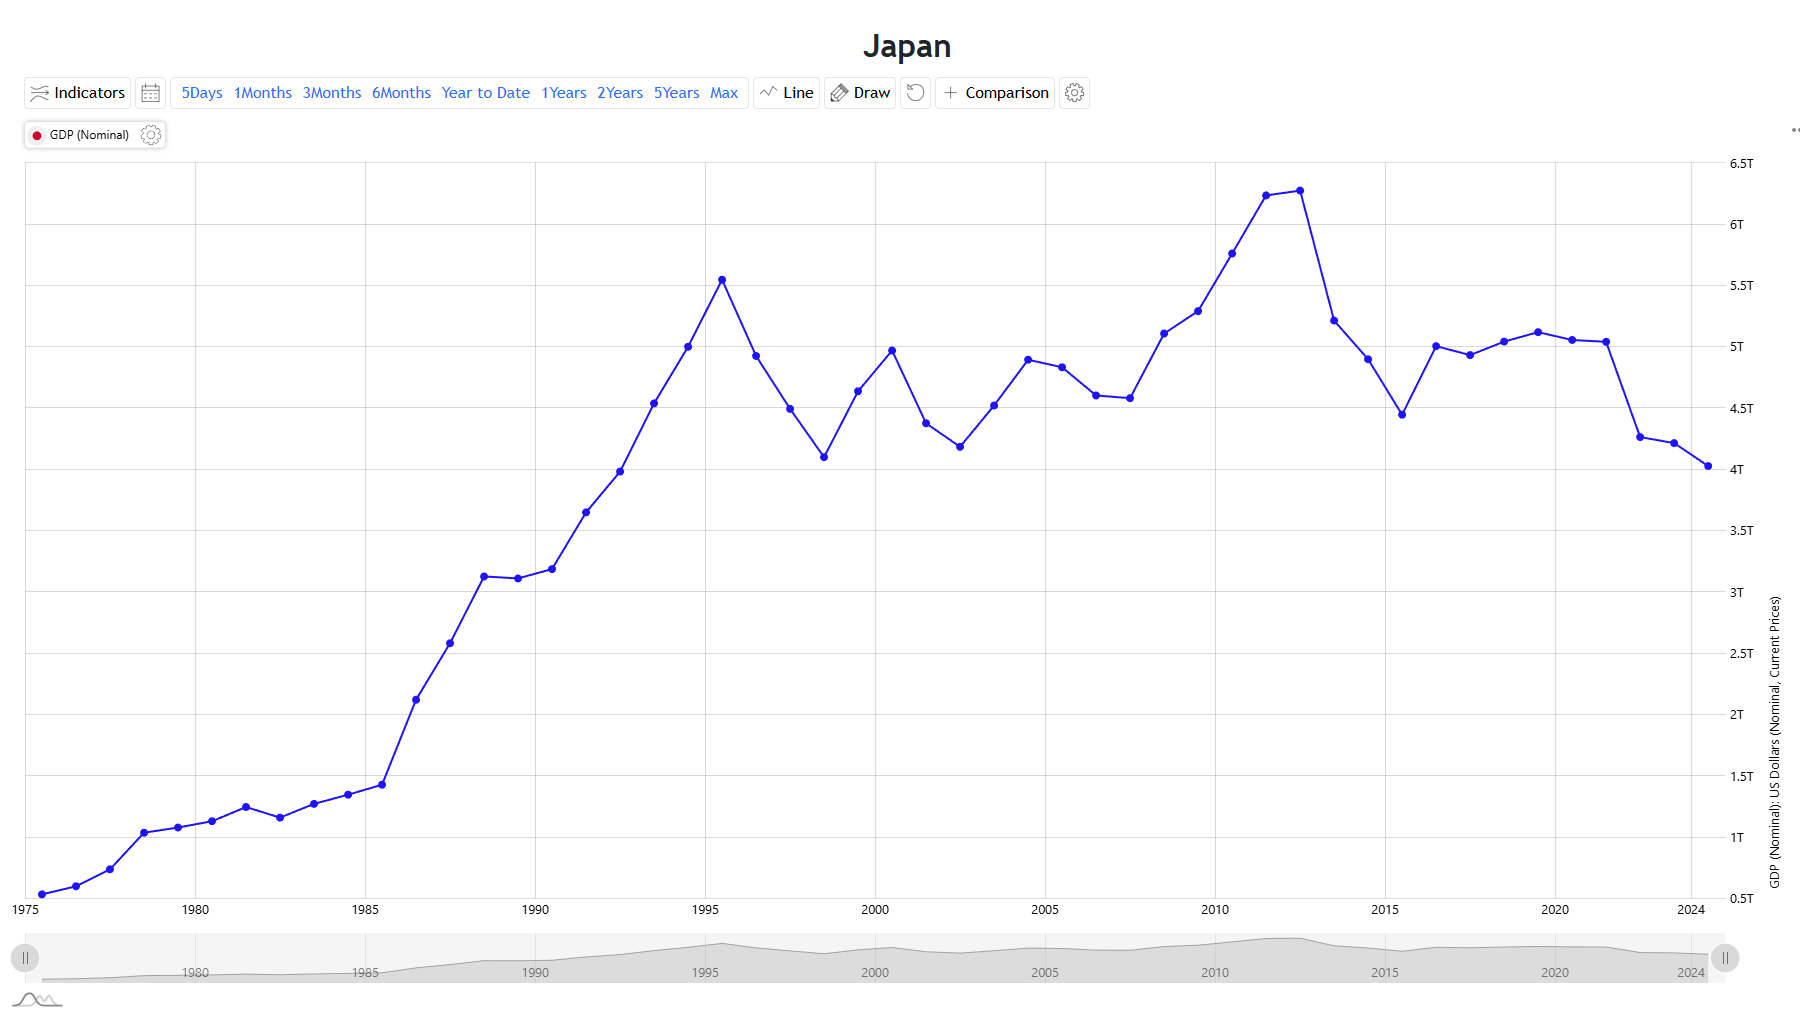
Economic Indicator Widget
A widget that can display the latest country-specific economic indicator data in graphs.
It supports simultaneous display of multiple economic indicators, changing display periods, applying analysis indicators, and easily toggling line colors and drawing methods.
Multi-Economic Indicator Widget
This widget displays the latest data on multiple economic indicators from around the world in graphs.
It can display multiple economic indicators simultaneously, allowing you to compare and understand the latest information.